(Decatur, IL, August 28, 2013) While the number of Illinois farms being offered for sale is down compared to a year ago, the value for what is being sold is up modestly across the board, according to the 2013 Mid-Year Land Values snapshot survey conducted by the Illinois Society of Professional Farm Managers and Rural Appriasers and the University of Illinois. The results of the survey were released here today.
The survey was conducted among membership of the Society with tabulation and results summarized by Gary Schnitkey, Ph.D., a professor and farm management specialist in the Department of Agricultural and Consumer Economics, University of Illinois. “The Society conducts a survey half way through the year to evaluate trends in farmland prices and cash rents. This information supplements the Society’s larger efforts at year-end to docu- ment farmland prices and cash rents across Illinois.”
“There was a tremendous push on land sales at the end of 2012 because of uncertainties concerning income tax treatment in 2013 and beyond,” says Dale Aupperle, AFM, ARA, Heartland Ag Group LTD., Forsyth, IL, overall chairman of the Society’s annual Illinois Land Values and Lease Trends project. “This led to a great deal of farm- land being sold last year that might have otherwise been available to the market in 2013. As a result, there is still a demand for farmland but not much available for sale.”
Aupperle notes that this dynamic has kept prices paid for land steady. “On July 1, 2013, farmland prices aver- aged $13,200 for excellent quality farmland, $11,200 for good land, $9,000 for average quality land, and $8,300 for fair quality farmland. This is an increase of 3 percent for excellent* and good quality farmland, 2.5 percent for average quality farmland, and 1.9 percent for fair quality land,” he explains. “These prices are not at the level of increases we’ve seen in recent years, but they are still upward.” He adds that the survey respondents expect the volume of land to be available for the balance of the year to be about the same as during the first six months.
(*Note: In the following, reference is made to different qualities of farmland. In a normal year, excellent quality farmland averages over 190 bushels of corn per acre, good quality farmland averages between 170 and 190 bush- els per acre, average quality farmland averages between 150 and 170 bushels per acre, and fair quality farmland averages below 150 bushels per acre.)
Schnitkey explains that the primary purchasers of land are still other farmers and local investors doing 85 per- cent of the buying. The number of non-local investors has slipped, no doubt because of other investment options such as the stock market, he says.
Key points of the survey:
Farmland Prices and Volume
1. For the first half of 2013, respondents indicate that land values increased by 3 percent for excellent and good quality farmland, 2.5 percent for average quality farmland and 1.9 percent for fair quality farmland.
2. On July 1, 2013, farmland prices averaged $13,200 for excellent quality farmland, $11,200 for good quality farmland, $9,000 for average quality farmland, and $8,300 for fair quality farmland.
3. Seventy percent of the respondents indicated that less farmland was sold in the first half of 2013 as compared to the second half of 2012. Partially explaining lower volume was a surge in farmland sales at the end of 2012 on account of uncertainties concerning income tax treatment in 2013 and beyond. Ninety-five percent of respon- dents indicated that there was an increase in land sales at the end of 2012.
4. Volume of sales in the last half of 2013 is expected to remain about the same as the first half of 2013. Twenty- three percent expect more volume, 43 percent expect the same volume, and 34 percent expect less volume.
5. Respondents indicates that buyers of farmland were:
73 percent were farmers,
12 percent were local investors,
8 percent were non-local investors, 5 percent were institutions, and
2 percent were other buyers.
6. Respondents indicated that farmers have increased as a percentage of buyers while local investors, non-local investors, and institutional investors have declined.
Farmland Price Expectations for the Next 12 Months
7. Respondents were divided in what was expected to be the price change over the next 12 months. Twenty percent expect farmland price to increase, 41 percent expect farmland price to remain the same, and 39 percent expect farmland price decreases. Of the 39 percent expecting decreases, 77 percent expect a price decrease from 0 to 5 percent.
8. Respondents were asked how likely a small price decline (less than 10 percent decline) is in the next 12 months:
7 percent believe a small price decline will happen,
38 percent indicate there is over a 50 percent chance of a small price decline,
53 percent indicate there is less than a 50 percent chance that it will happen, and 2 percent indicate that it will not happen.
9. Respondents were asked how likely a large price decline (greater than 10 percent decline) is in the next 12 months. Most respondents believe there is a small chance of a large price decline:
6 percent indicate that there is over a 50 percent chance of a large price decline
38 percent indicate that there is between a 10 and 50 percent chance of a large price decline, 33 percent indicate a 1 to 10 percent chance of a large price decline, and
24 percent indicate that a large price decline will not happen.
10. Respondents expected the sales price of corn on the 2013 crop to average $4.92. Most respondents expect 2013 corn yields to be above the five-year average. Sixty-six percent expect above average corn yields, 18 percent expect average corn yields, and 16 percent expect below average corn yields.
Factors Impacting Farmland Prices
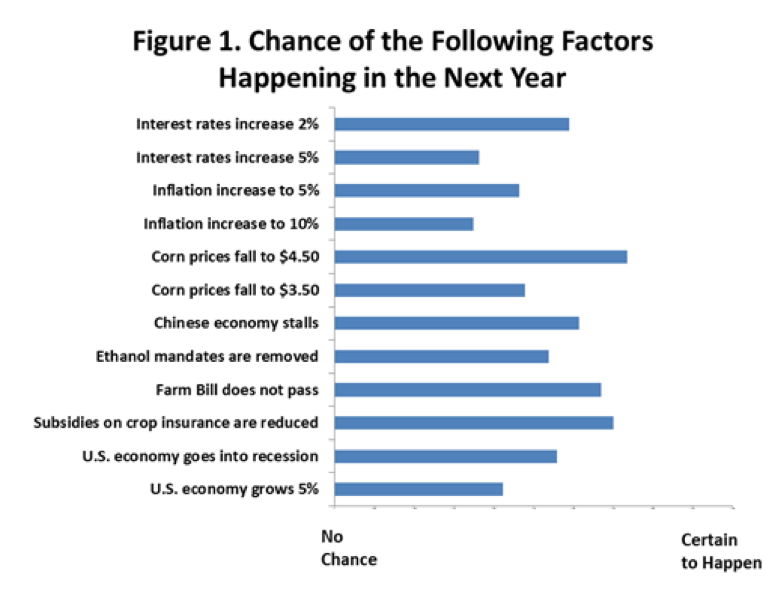
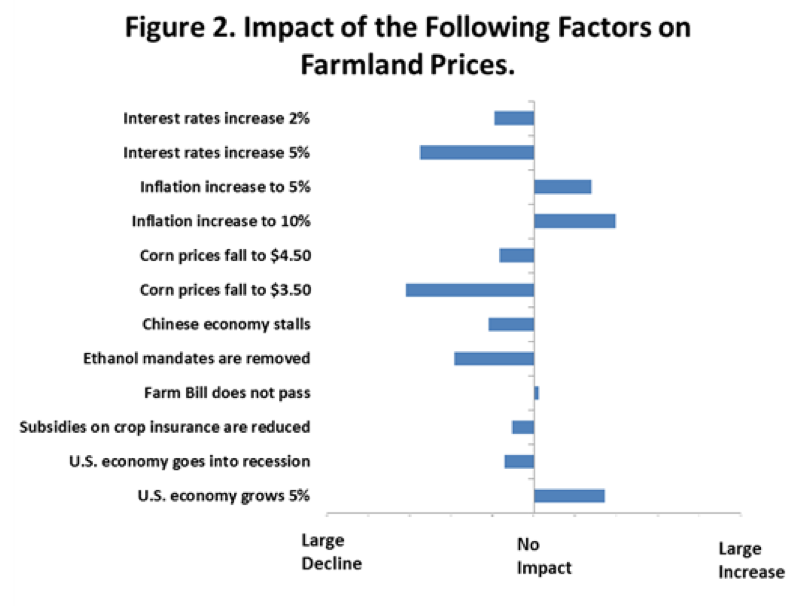
11. Respondents were given the list of factors on the vertical axes on Figure 1 and Figure 2. Respondents were asked to rate the probability of each of factors happening in the next year (see Figure 1). They were also asked to indicate the impact of that factor on farmland prices, if it happened.
12. Most likely factors of occurring are “corn prices fall to $4.50”, “subsidies on crop insurance are reduced”, “Farm Bill does not pass”, and “interest rates increased by 2 percent”. Factors least likely of happening are “infla- tion increases by 10 percent and “interest rates increase 5 percent”.
13. If they happen, the factors indicated of having the most positive impact on farmland prices are “U.S. econo- my grows 5 percent” and “inflation increases to 10 percent”. The factors estimated to have the most negative im- pact on farmland prices are “Corn prices fall to $3.50”, “interest rates increase 5 percent”, and “Ethanol mandates are removed”.
Farmland Price Expectations over the Next Five Years
14. Respondents were divided on expected farmland price increases over the next five years. Respondents were asked what they expected changes in farmland prices to average over the next five years (a response of “10 percent” indicates that farmland will increase an average of 10 percent each year over the next five years). Forty- six percent of respondents expected prices to average an increase between 1 and 5 percent the next five years, 9 percent expected farmland prices to remain the same, and 45 percent expected price decreases.
15. Respondents were asked what chances are a 1980s-style price decline will happen over the next five years. Most respondents indicate no or a small chance of an event of this nature:
39 percent of the respondents indicate that a 1980s-style decline will not happen,
44 percent indicate a less than 10 percent chance of 1980s-style decline of happening, and 17 percent indicate that there is between a 10 and 50 percent chance of it happening.
2013 and Expected 2014 Cash Rents
16. Respondents expect small decreases in cash rents from 2013 and 2014. Respondents indicate that excellent quality farmland had a $388 per acre cash rent in 2013, and an expected cash rent of $374 per acre in 2014. Good quality farmland had a $332 per acre average cash rent in 2013 with an expected cash rent of $318 per acre in 2014. Average quality farmland had a $318 per acre average cash rent in 2013 and expected cash rent of $278 per acre in 2014. Fair quality farmland had $224 per acre cash rent in 2013 and expected cash rent of $212 per acre for 2014.
17. Respondents expect corn prices to average $4.75 per bushel during the next five years.
18. Most respondents expect slight decreases in production costs moving into 2014. Fifty-six percent of respon- dents expect production cost to decline slightly, 21 percent expect production costs to remain the same, and 23 percent expect increases in production costs.
19. Respondents indicate the following use of lease types: 25 percent are share rent leases,
19 percent are modified share rent leases,
35 percent are cash rent leases,
14 percent are variable cash rent lease, and 7 percent are custom farming.
20. Respondents indicated that share rent and modified share rent lease leases declined in use. Variable cash rent leases were the lease type with the largest increase, followed by cash rent.
Editorial Contact Information:
Bruce Huber, AFM, ARA
President, ISPFMRA
217-872-6291 bruce.huber@hickorypointbank.com
Dale Aupperle, AFM, ARA
Chairman, ISPFMRA Land Values and Lease Trends 217-876-7700
dale@heartlandaggroup.com
Gary Schnitkey, Ph.D. University of Illinois 217-244-9595 schnitke@illinois.edu